02 Data
Data can be anything. It depends on the data engineer on what the input and output data is.
Types
- Structured
- Numbers
- Tables
- Unstructured
- Audio
- Image
- Video
Means of data collection
Garbage-in, Garbage-out
- Manual Labelling
- Manually marking as cat/not cat, etc.
- Observing Behaviour
- taking data from user activity and seeing whether they purchased or not
- machine temperatures and observing for faults or not
- Download from the web
Mistakes
- Waiting too long for implementing a data set
- implement it early so that AI team can give feedback to the IT team
- Not all data is valuable
- Messy
- Garbage in, garbage out
- incorrect data
- multiple types of data
Datasets
Collection of data in rows and columns
- Rows = Objects, Records, Samples, Instances
- Columns = Attributes, Variables, Dimensions, Features
Types
- Labelled has Target variable
- Unlabelled does not have target variable
Types of Attributes
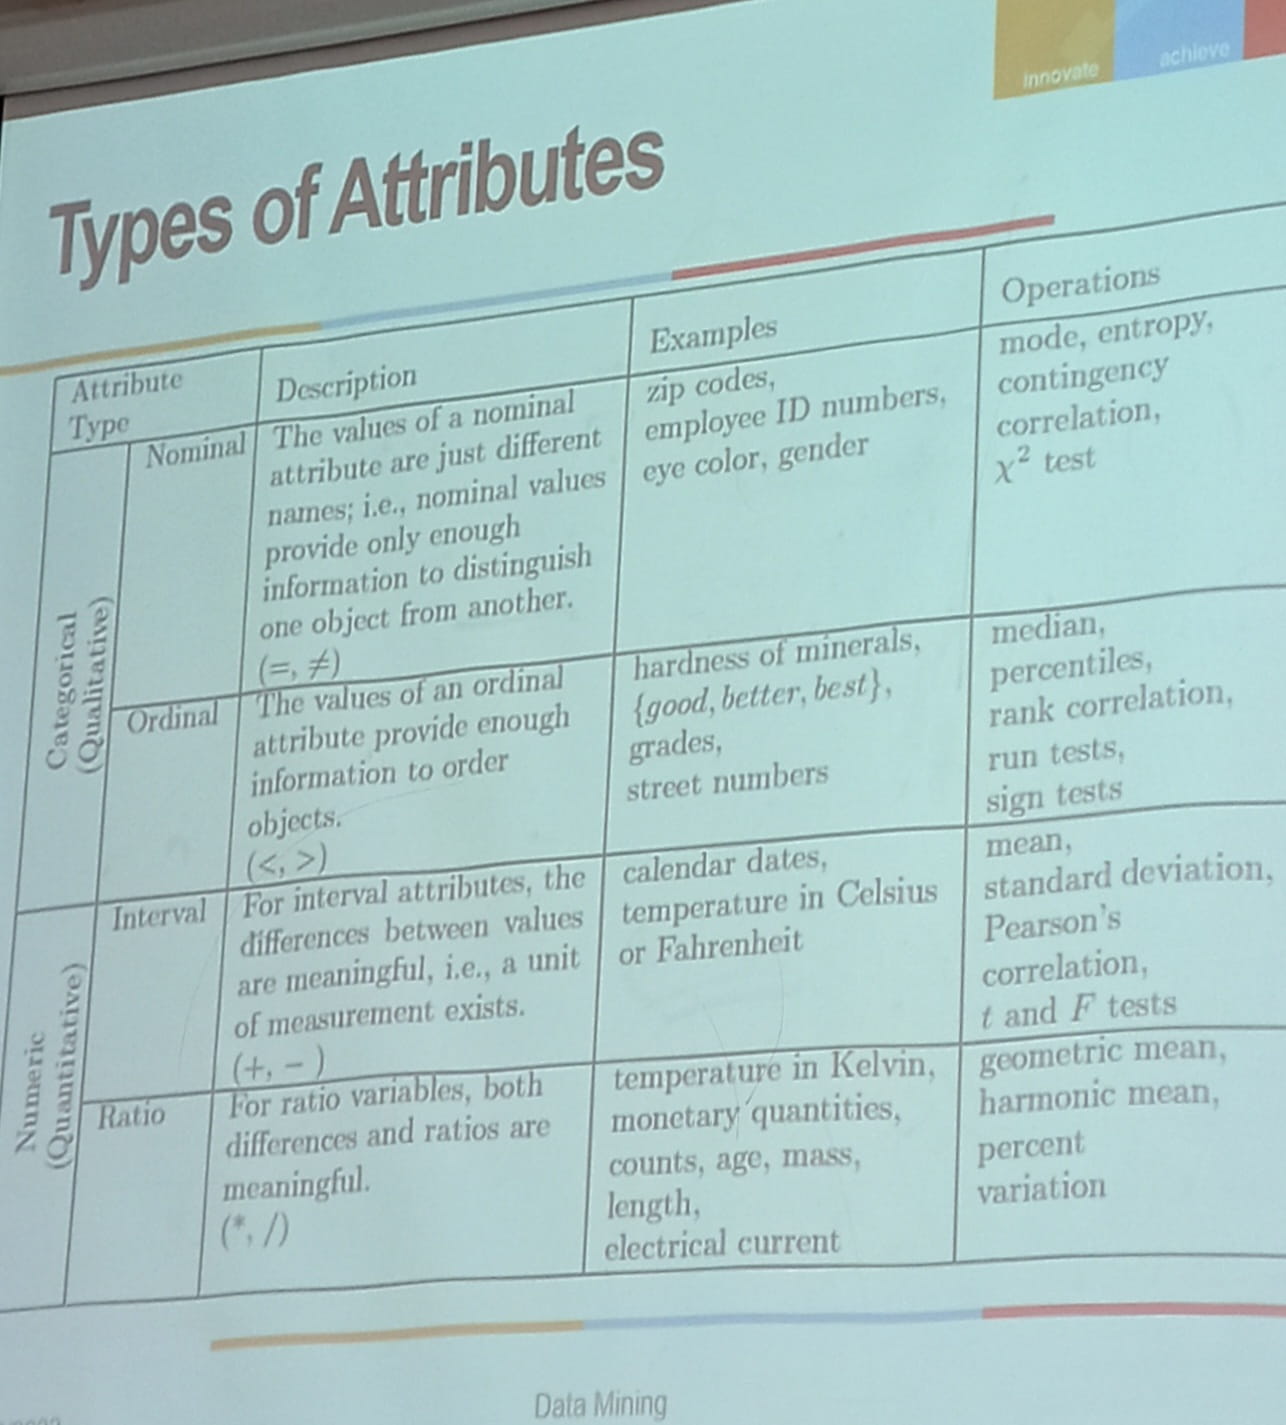
| Nominal | Ordinal | Interval | Ratio | |
|---|---|---|---|---|
| Order | ✅ | ✅ | ✅ | |
| Magnitude | ✅ | ✅ | ||
| Absolute Zero | ✅ | |||
| Mode | ✅ | ✅ | ✅ | ✅ |
| \(=\) | ✅ | ✅ | ✅ | ✅ |
| \(>, \ge, <, \le\) | ✅ | ✅ | ✅ | |
| \(-, +\) | ✅ | ✅ | ||
| \(/, \times\) | ✅ | |||
| Type | D | D | N | N |
| Median | ✅ | ✅ | ✅ | |
| Mean | ✅ | ✅ | ||
| Min/Max | ✅ | ✅ | ||
| t-Test | ✅ | |||
| Example | - Colors - Player Jersey # - Gender - Eye color - Employee ID | - Ratings - Course Grades - Finishing positions in a race; 4star is not necessarily twice as good as 2 star | - Temperature units - 100C > 50C > 0C; 0C, 0F doesn't mean no temperature; 50C isn't \(\frac{1}{2}\) of 100C - pH scale | - Age - Kelvin - 0K is absolute absence of heat; 50K = half of 100K - Number of children |
- D = Discrete/Qualitative/Categorical
- N = Numerical/Quantitative/Continuous
Asymmetric Attributes
Attributes where only non-zero values are important. It can be
- Binary (0 or 1)
- Discrete (0, 1, 2, 3, …)
- Continuous (0, 33.35, 52.99, …)
Characteristics of Dataset
Sample Size
| \(n_\text{min}\) | \(n_\text{recommended}\) | |
|---|---|---|
| Tabular | \(k+1\) | \(10^k\) |
| Image | \(1000 \times C\) |
where
- \(n =\) no of sample points
- \(k =\) no of input variables
- \(C =\) no of classes
Dimensionality
No of features
Sparseness
If majority of attributes have 0 as value, depending on the context
Resolution
Detail/Frequency of the data (hourly, daily, monthly, etc)
Types of Datasets
Records
Collection of records having fixed attributes, without any relationship with other records
| Type | Characteristic | Example |
|---|---|---|
| Data Matrix | All attributes are numerical | Usually what we have |
| Sparse Data Matrix | Majority of values are 0 | - Frequency distribution kinda thingy for market basket data - Document term matrix |
| Market Basket Data | Every record of transactions, with collection of items | - Association analysis market data |
Graph
| Type | Example | |
|---|---|---|
| Data objects with relationships | Nodes(data objects) with edges (relationships) between them | Google Search indexing |
| Data objects that are graphs | Chemical structures |
Ordered
Relationships between attributes
Sequential/Temporal
Extension of record, where each record has a time associated with it.
Even this can be time series data, if recorded periodically.
| Time | Customer | Items Purchased |
|---|---|---|
| t1 | c1 | A, B |
| t2 | c2 | A, C |
Time-Associated
| Customer | Time and Items Purchased |
|---|---|
| C1 | \(\{t1, (A, B) \}, \{t2, (A, C) \}\) |
| C2 | \(\{t1, (B, C) \}, \{t2, (A, C) \}\) |
Sequence Data
Sequence of entities
Eg: Genomic sequence data
Time Series Data
Series of observations over time recorded periodically
Each record is a time series as well.
| 12AM | 6AM | 12PM | 6PM | |
|---|---|---|---|---|
| June 11 2020 | ||||
| June 12 2020 | ||||
| June 13 2020 | ||||
| June 14 2020 |
Spatial Data
Data has spatial attributes, such as positions/areas
Weather data collected for various locations
Spatio-Temporal Data
Data has both spatial and temporal attributes
| Abu Dhabi | Dubai | Sharjah | Ajman | UAQ | RAK | Fujeirah | |
|---|---|---|---|---|---|---|---|
| June 11 2020 | |||||||
| June 12 2020 | |||||||
| June 13 2020 | |||||||
| June 14 2020 |
Issues with Data Quality
| Issue | Solution is to ___ data object/attributes | Example | |
|---|---|---|---|
| Noise | - Random component of measurement - Distorts the data | Drop | |
| Artifacts | Known Distortion | ||
| Outliers | Actual data, but very different from others | Depends | |
| Missing Values | Null values | - Eliminate - Estimate/Interpolate - Ignore | |
| Inconsistent Data | illogical data | 50yr old with 5kg weight | |
| Duplicate Data | De-Duplication | - Same customer goes to multiple showrooms |
Estimation
| Attribute Type | Interpolation Value | Example |
|---|---|---|
| Discrete | Mode | Grade |
| Continuous | Mean/Median (depending on the situation) | Marks |
Data
Data can be structured/unstructured
- Each column = feature
- Each row = instance
Data Split
- Train-Inner Validation-Outer Validation-Test is usually 60:10:10:20
- Split should be mutually-exclusive, to ensure good out-of-sample accuracy
The size of test set is important; small test set implies statistical uncertainty around the estimated average test error, and hence cannot claim algo A is better than algo B for given task.
Random split is the best. However, random split will not work well all the time, where there is auto-correlation, for eg: time-series data
flowchart LR

td[(Training Data)] -->
|Training| m[Model] -->
|Validation| vd[(Validation)] -->
|Tuning| m --->
|Testing| testing[(Testing Data)]
Multi-Dimensional Data
can be hard to work with as
- requires more computing power
- harder to interpret
- harder to visualize
Feature Selection
Dimension Reduction
Using Principal Component Analysis
Deriving simplified features from existing features
Easy example: using area instead of length and breadth.
Categories of Data
| Mediocristan | Extremistan | |
|---|---|---|
| Each observation has low effect on summary statistics | ✅ | ❌ |
| Example | IQ, Weight, Height, Calories, Test Scores | Wealth, Sales, Populations, Pandemics |
| Law of Large Numbers | Requires more samples for approaching the true mean | |
| Mean is meaningless | ||
| Regression does not work \(R^2\) reduces with larger sample sizes | ||
| Payoffs diverge from probabilities It’s not just about how often you are right, but also what happens when you’re wrong: Being wrong 1 time can erase the gain of being right 99 times |
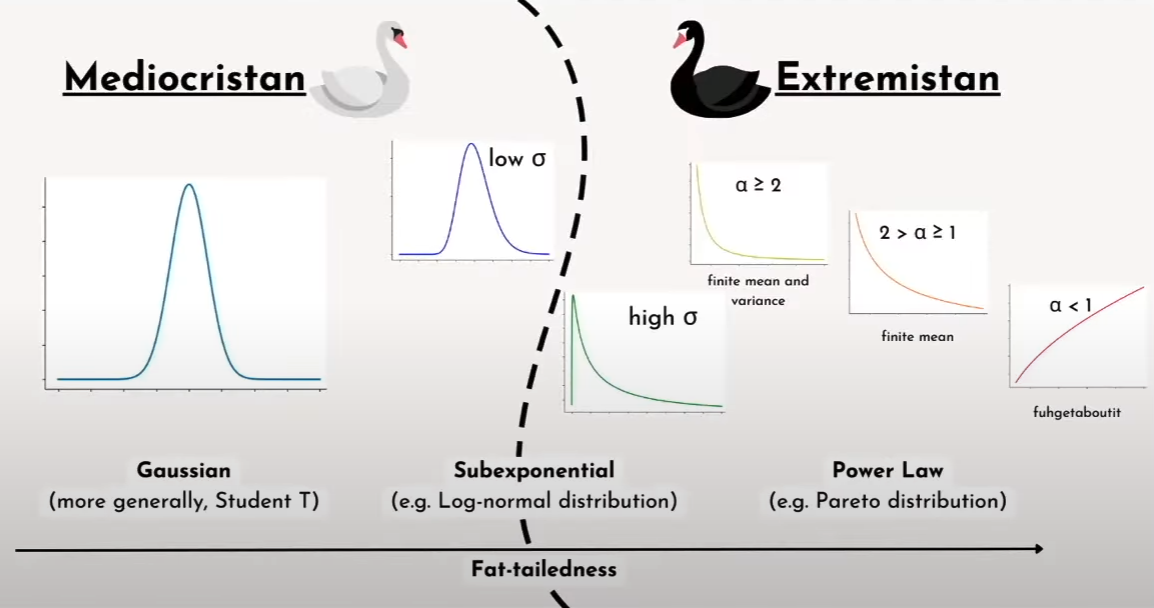
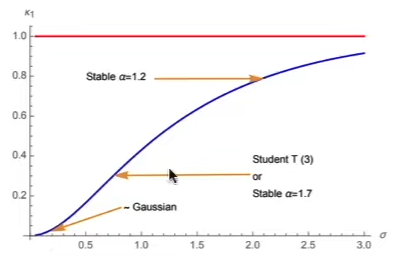
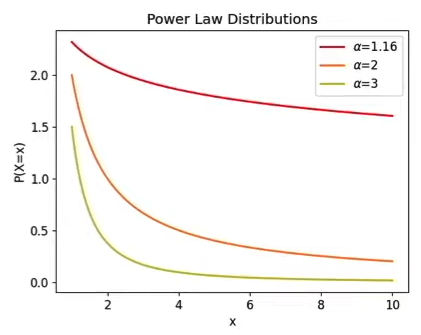
“Fat-Tailedness”
Degree to which rare events drive the aggregate statistics of a distribution
- Lower \(\alpha \implies\) Fatter tails
- Kurtosis (breaks down for \(\alpha \le 4\))
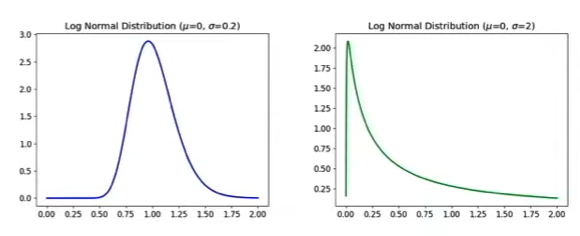
- Variance of Log-Normal distribution
- Taleb’s \(\kappa\) metric