07 Analysis of Financial Statements
Types of Analysis
| Analysis | Understand | Values | Formula |
|---|---|---|---|
| Absolute | Actual Values | ||
| Horizontal/ Dynamic | Trend over the years | All values compared to a base year | \(\frac{V}{V_\text{base}} \times 100\%\) |
| Vertical/ Static | Particular period | All values compared to the total assets in the same period | \(\frac{V}{\text{Total Assets}}\times 100\%\) (Balance Sheet) \(\frac{V}{\text{Net Cashflow}}\times 100\%\)(Cash Flow) \(\frac{V}{\text{Total Revenue}}\times 100\%\)(Income Statement) |
| Ratio | Take ratio to create a combination of values and infer something |
All types of analysis is important, as they each may give different inferences.
Balance Sheet
| Variable | Meaning | |
|---|---|---|
| SHAREHOLDER'S FUNDS | Equity Share Capital | Ownership stake (increases with Stock split) |
| Total Share Capital | ||
| Reserves and Surplus | Retained earnings | |
| Total Reserves and Surplus | ||
| Total Shareholders Funds | ||
| Equity Share Application Money | ||
| Hybrid/Debt/Other Securities | ||
| NON-CURRENT LIABILITIES | Pending after a year | |
| Long Term Borrowings | Loans/Bonds | |
| Deferred Tax Liabilities [Net] | Postponed taxes | |
| Other Long Term Liabilities | Mortgages | |
| Long Term Provisions | Conditional Guarantees/Warranties Employment benefits, pensions | |
| Total Non-Current Liabilities | ||
| CURRENT LIABILITIES | Pending within a year | |
| Short Term Borrowings | ||
| Trade Payables | What you owe suppliers Other parties will only tolerate if you are dominant in the market | |
| Other Current Liabilities | Current Portion of Long-Term Debt | |
| Short Term Provisions | Provisions for immediate conditional compensations such as legal issues, etc | |
| Total Current Liabilities | ||
| Total Capital And Liabilities | ||
| ASSETS | ||
| NON-CURRENT ASSETS | ||
| Tangible Assets | Physical | |
| Intangible Assets | Non-Physical | |
| Capital Work-In-Progress | Products in progress | |
| Intangible Assets Under Development | R&D | |
| Fixed Assets | ||
| Non-Current Investments | ||
| Long Term Loans And Advances | Giving loans to subsidiaries, as the parent company get cheaper loans Tax evasion | |
| Other Non-Current Assets | Machinery, Equipment | |
| Total Non-Current Assets | ||
| CURRENT ASSETS | ||
| Current Investments | Money market (loans between 7 & 365 days) | |
| Inventories | ||
| Trade Receivables | ||
| Cash And Cash Equivalents | Anything that can used as payment, such as Cash/Cheques/Credit slips | |
| Short Term Loans And Advances | ||
| Other Current Assets | ||
| Total Current Assets | ||
| Total Assets |
Trenches is when you securitize a loan that you lent, and then trade it to the public. 2008 financial crisis
Sinking fund is the repayment of bond
Generally, steel plants
Income Statement
| Meaning | |
|---|---|
| INCOME | |
| Revenue From Operations [Gross] | |
| Less: Excise/Sevice Tax/Other Levies | |
| Revenue From Operations [Net] | |
| Other Operating Revenues | |
| Total Operating Revenues | |
| Other Income | |
| Total Revenue | |
| EXPENSES | |
| Cost Of Materials Consumed | |
| Purchase of Stock-In Trade | Purchase of ready-made input for production |
| Changes In Inventories Of FG,WIP And Stock-In Trade | |
| Employee Benefit Expenses | |
| Finance Costs | |
| Depreciation And Amortisation Expenses | |
| Other Expenses | |
| Less: Amounts Transfer To Capital Accounts | |
| Total Expenses | |
| Profit/Loss Before Exceptional, ExtraOrdinary Items And Tax | |
| Exceptional Items | |
| Profit/Loss Before Tax | |
| Tax Expenses-Continued Operations | |
| Current Tax | |
| Deferred Tax | |
| Total Tax Expenses | |
| Profit/Loss After Tax And Before ExtraOrdinary Items | |
| Profit/Loss From Continuing Operations | |
| Profit/Loss For The Period | |
| OTHER ADDITIONAL INFORMATION | |
| EARNINGS PER SHARE | |
| Basic EPS |
If total shareholders funds increases over time, the company is very good, regardless if equity share capital dec.
Cashflow Statement
| NET PROFIT/LOSS BEFORE EXTRAORDINARY ITEMS AND TAX | |
| Net CashFlow From Operating Activities | |
| Net Cash Used In Investing Activities | |
| Net Cash Used From Financing Activities | |
| Foreign Exchange Gains / Losses | |
| Adjustments On Amalgamation Merger Demerger Others | |
| NET INC/DEC IN CASH AND CASH EQUIVALENTS | |
| Cash And Cash Equivalents Begin of Year | |
| Cash And Cash Equivalents End Of Year |
Ratio Analysis
| Aspect | Ratio | Recommended |
|---|---|---|
| Liquidity | Current Ratio | 2:1 |
| Quick Ratio/ Acid Test | ||
| Cash Ratio | ||
| Profitability | Gross Profit Ratio | |
| Operating Profit Ratio | ||
| Net Profit Ratio | ||
| Solvency Ratio | Debt-Equity Ratio | |
| Interest Coverage Ratio | ||
| Turnover Ratio | Fixed Asset Turnover Ratio | |
| Inventory Turnover Ratio | ||
| Receivable Turnover Ratio | ||
| Earning Ratio | Profit-Earning Ratio | |
| Earning Per Share |
Misc
Types of Investments
| Relationship | Amount |
|---|---|
| Subsidiary | > 50% |
| Associate | 20% < A < 50% |
| Minority Interest | < 20% |
Shares
‘Splitting’ shares = fragmentation
Base capital
| Authorized capital | |
| Paid-up capital | |
| Equity shares |
Reserve and Surplus involves
- Retained earnings
- Overage from premium surplus
| Face Value | |
| Book/Intrinsic Value | |
| Market Value |
Dividend of 200% means 200% of face value
Stock Splits
Causes market noise
Market Noise
Unnecessary oscillation
Herding behavior
Re-Investment Risk
Solvency
Ability of a company to cover its long-term financial obligations
Insolvency
Financial Distress
When Current assets < Hard Contracts
Types of Lease
An operating lease is a contract that permits the use of an asset without transferring the ownership rights of said asset. A finance lease is a contract that permits the use of an asset and transfers ownership after the lease period is complete, and the lessor meets all other contract obligations.
Ratio Analysis
| Represents | ||
|---|---|---|
| NI | Net Income | |
| TE | Total Equity | |
| IDK | ||
| \(\tau\) Effective Tax Rate | Current Tax/PBT | |
| Working Capital | Current Assets - Current Liabilities | |
| Cash Expenses per Day | Total Expenses/365 |
| Overall Performance Ratio | |
| ROA/ROTA (Before Tax) | EBIT/TA |
| ROA/ROTA (After Tax) | EBIT*(1-\(\tau\))/TA |
| ROE | NI/Equity |
| ROCE (Before Tax) | EBIT/TA-CL |
| ROCE (After Tax) | EBIT(1-t)/TA-CL |
| Profit Margin Ratios | |
| EBITDA Margin | EBITDA/Sales |
| EBIT Margin/OPM | EBIT/Sales |
| EBT Margin | EBT/Sales |
| Net Profit Margin | NI/Sales |
| Asset Turnover Ratio | Sales/Total Assets |
| Two Factor Dupont Analysis | |
| ROA | EBIT margin * ATR |
| Three Factor DuPont | |
| NPM | NI/Sales |
| ATR | Sales/Total Assets |
| Total Leverage | Total Assets/Equity |
| ROE | NPM * ATR * TL |
| Five Factor Dupont | |
| Tax Factor | NI/EBT |
| Interest Factor | EBT/EBIT |
| EBIT Margin | EBIT/Sales |
| ATR | Sales/TA |
| TL | TA/Equity |
| ROE | TF * IF * EM * ATR * TL |
| Turnover or Efficiency Ratios | |
| Non-Current Asset Turnover Ratio | Sales/NCA |
| PPE Utilisation Ratio/ Capital Intensity Ratio | Sales/PPE |
| Current Asset Turnover Ratio | Sales/CA |
| Equity Turnover Ratio | Sales/Equity |
| Working Capital Ratios | |
| Working Capital Turnover Ratio | Sales/Working Capital |
| Inventory Turnover Ratio (ITR) | Sales/Inventory |
| Days Inventory | 365/ITR |
| Debtors Turnover Ratio (DTR) | Sales/Accounts Receivable |
| Days receivable or Average Collection Period | 365/DTR |
| Days Cash | Cash/ Cash Expenses per Day |
| Creditor Turnover Ratio (CTR) | Material Consumed/Accounts Payable |
| Days Creditors/Average Payment Period | 365/CTR |
| Cash Conversion Cycle (Days) | Days inventory + Days debtors + Days Cash - Days Payable |
| Insolvency Ratio | |
| Debt | All interest bearing liabilites are debt |
| Debt/Equity Ratio | Total Debt/ Equity |
| Debt Ratio /Debt Capitalisation Ratio | Debt/ (Debt + Equity) |
| Equity Ratio/ Equity Capitalisation Ratio | Equity/(Debt + Equity) |
| Interest Coverage Ratio | EBIT/ Interest |
| Total Debt Service Ratio | EBIT/ (Interest + Debt) |
| Test of Dividend Policy | |
| Dividend Per Share | Dividend Declared/ No. of share outstanding |
| Earning Per Share | NI/ No of share outstanding |
| Dividend Yeild Ratio | Dividend/ Current Market Price |
| Dividend Payout Ratio (D/P Ratio) | DPS/EPS = Dividend Declared/NI |
| Retension Ratio | 1 - D/P Ratio |
| Liquidity Ratios | |
| Current Ratio | Current Assets/ Current Liabilities |
| Quick Ratio/ Acid Test Ratio | (CA-Inventory)/ CL |
| Valuation Ratios | |
| Book Value per Share | Total Equity/ No. of Share Outstanding |
| Market Value Per Share (on balance sheet date) | market value of share |
| Earning Per share | NI/ No of share outstanding |
| Price Earning Ratio (P/E) | MPS/EPS |
| Price to Book Value Ratio (P/B) | MPS/BVPS |
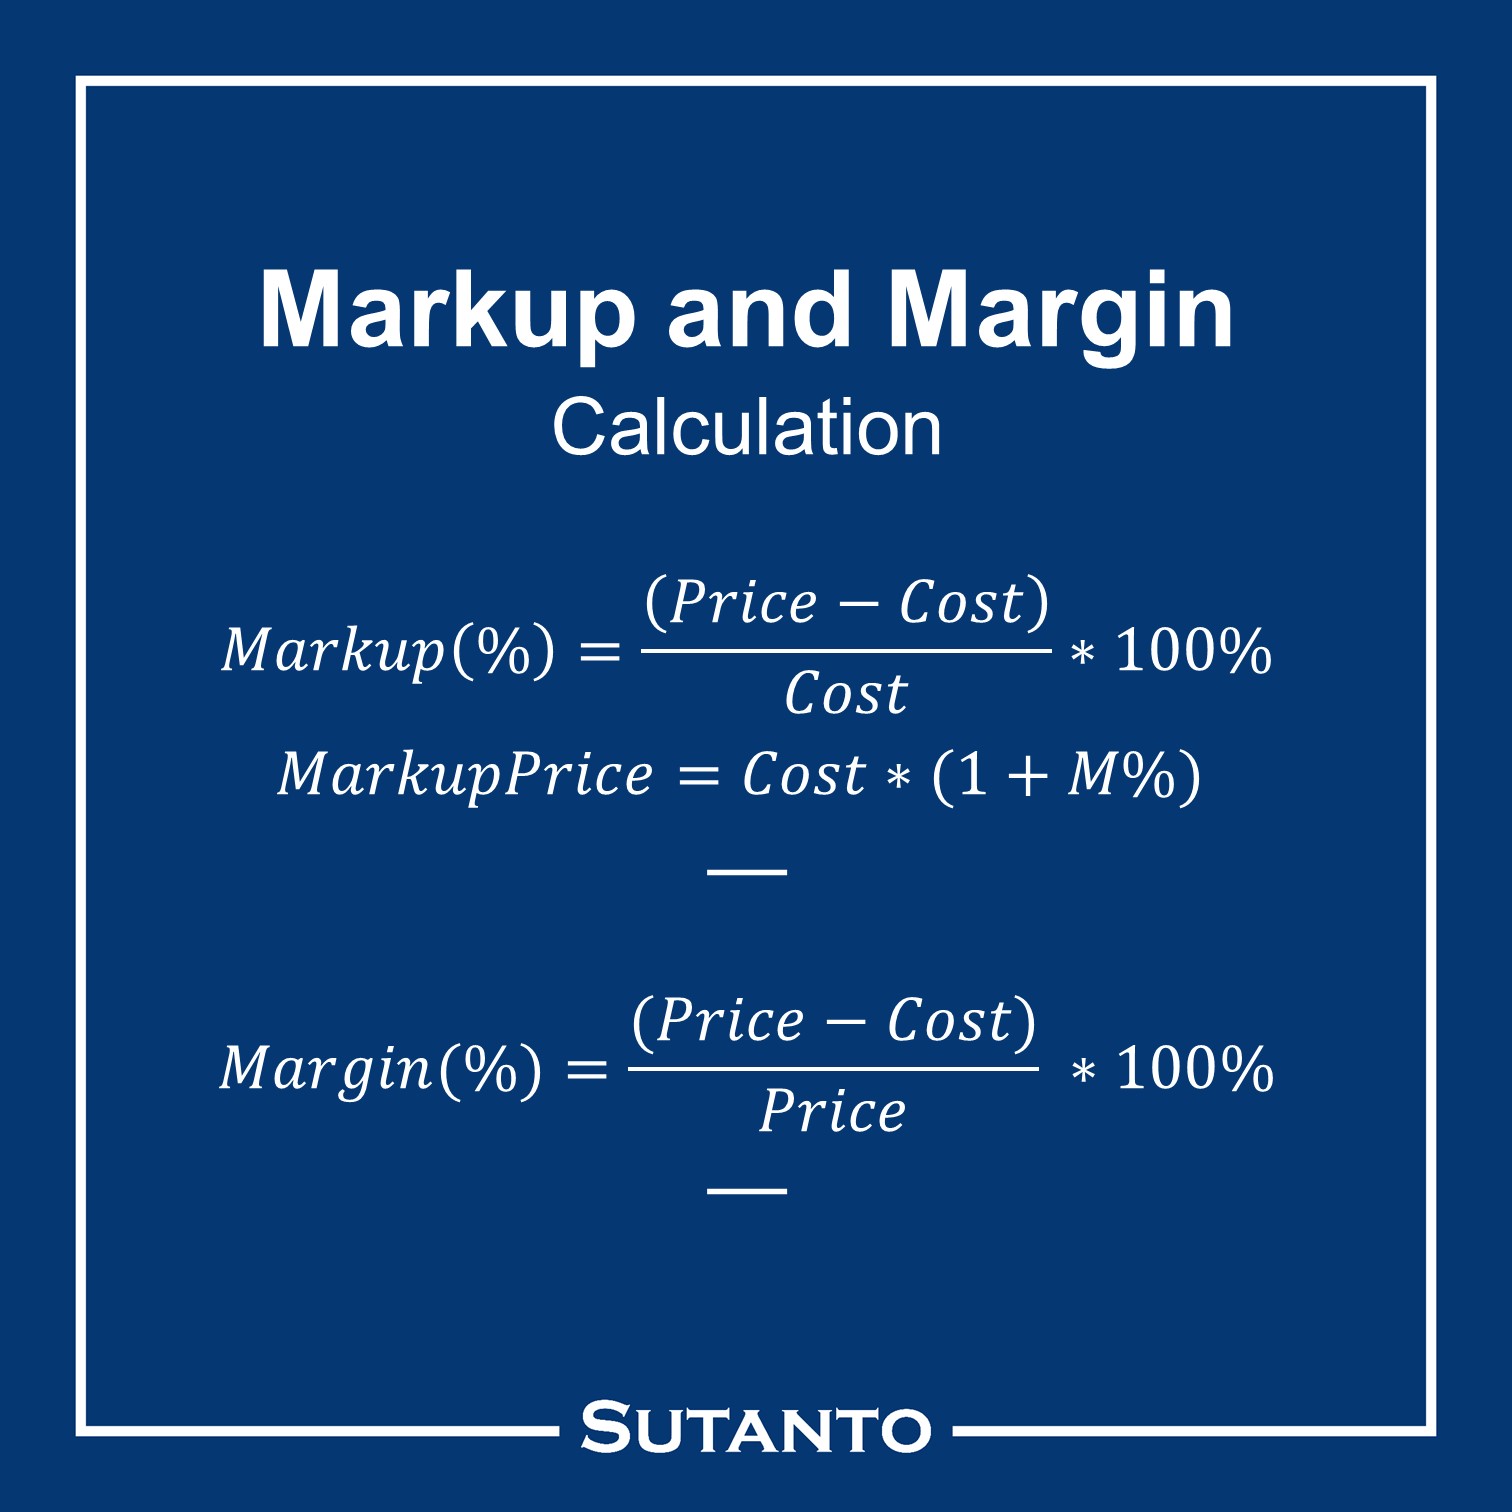
Margin vs Markup
Return vs Yield
| Return | Yield | |
|---|---|---|
| Calculated relative to | Initial invested capital | Current Market Price |