06 Elements of Market
Elements of Market
- Demand
- Supply
- Equilibrium
Demand
indicates optimal quantity of commodities which consumers are willing and able to buy at a particular price, in a particular period
if prices change, demand also changes
Law of Demand
Assuming every factor (like preferences, current state affairs) remains constant, \(\text{demand} \propto \frac{1}{\text{price}}\) this goes other way round too
Individual Demand Curve
can vary from one individual to another even for the same commodity, due to Factors of Trade
graph is a straight line with a negative slope
- x = Demand
- y = price
Be careful of the slope, cuz the slope formula is for the inversed graph of the demand Curve Slope \(= \frac 1 {\alpha_2}\)
| Term | Meaning |
|---|---|
| \(x\) | Demand |
| \(P\) | Price |
| \(\alpha_2\) | Sensitivity of demand wrt price The no of units of demand decreases by when the price increases by 1 unit - Necessities have low sensitivity - Luxury goods have high sensitivity |
| \(\alpha_1\) | Demand even when commodity is free Captures impact of all other factors that affect the demand (Income of consumers, advertising, etc) |
Graph Characteristics
| Horizontal Graph | Vertical Graph | |
|---|---|---|
| Slope of graph | \(\to 0\) | \(\to \infty\) |
| \(\alpha_2\) | \(\to \infty\) | \(\to 0\) |
| sensitivity | High | Low |
| even a small change in price will cause variation in demand | even large changes in price cause negligible change in demand | |
| Example | when there are too many sellers and buyers; and only one seller changes the price | medicines, food |
Market Demand
total demand for a commodity in a market at a particular price
summation of individual demands for commodity at particular prices
Giffen Goods
Law of demand not applicable for them
eg: BW TVs, Nokia Phone
\(\text{demand} \propto \text{price}\)
Factors of Demand
Out of the following factors, economic policies mainly target the expectations factor
Income and Wealth
More income and wealth means more spending and hence, higher demand
- Income is flow of money currently
- Wealth is what we have accumulated over time
| Relationship Type | Elastic Demand? | Shift in individual demand curve | Consumption at same price | Example |
|---|---|---|---|---|
| +ve | ✅ | Rightward | Greater | Luxury Items |
| Neutral | ❌ | None | Same | Staple foods |
| -ve | ✅ | Leftward | Lower | Inferior and Giffen goods |
Types of Goods based on Income Elasticity
| Type | Income Elasticity | |
|---|---|---|
| Superior | +ve | Smartphones, LED TVs, Cars |
| Necessities | 0 | Staple foods |
| Inferior | -ve | B/W TV, tungsten bulbs, public transport |
Price of Other goods
Cross Price is measured by \(\alpha_3\)
when price of complimentary good increases, the demand of main commodity decreases when price of substitute good increases, the demand of main commodity increases
hence, if
- \(\alpha_3 > 0\) substitute
- \(\alpha_3 < 0\) complimentary
Types of Goods based on Income Elasticity
| Example | ||
|---|---|---|
| Complimentary goods | Goods that are consumed together | Car & Petrol |
| Substitute Goods | Goods that are alternatives of each other | Pepsi & Coke |
Tastes/Preferences
idk how to write this
Customer Expectations
| Expectation | Meaning | Explanation |
|---|---|---|
| Expected Price | What I predict to be the price of the commodity in the future | If expected price > current price, then demand increases, which ends up increasing the price; whether or not it would’ve happened naturally, nobody will know 😆; here, our expectations clearly affects the actual outcome If expected price < current price, then demand decreases |
| Expected | What I predict to be my income in the future |
Market Size
No of buyers in the market
Advertising Expenditure
Does not affect the product, but changes the perception of the product in consumers’ heads
Season/Time of the Year
- demand for cotton is greater in summer
- demand for wool is greater in winter
Supply
is the optimal quantity which sellers are willing and able to sell at a given price, in a particular period
Law of Supply
Assuming that factors are same, supply \(\propto\) selling price of commodity
Contemporary Relation
\(S = \beta_1 + \beta_2 P_{t}\)
- land
- eggs
- milk
Lagged Relation
\(S = \beta_1 + \beta_2 P_{t-1}\)
For commodities with large gestation period, such as agricultural
Terms
- \(\beta_1 =\) minimum selling price for which suppliers are willing to produce commodity
- \(\beta_2 =\) sensitivity of supply wrt price
Graph
- y = P
- x = S
| Shift | Supply for the same price |
|---|---|
| Outward | Greater |
| Inward | Lower |
All points on the supply curve show the optimal supplies Any point inside/outside the supply curve will not provide maximum profit
Individual Supply
Every firm has different supply curve due to difference in cost structures
Market Supply
Total supply for a commodity in a market at a particular price
Summation of supplies of commodity by different firms at particular prices
Factors of Supply
Cost of Production
input prices, technology
if cost inc, supply dec
Expectations
- if expected price/returns > current price, then supply increases
- else supply decreases
Price of related products
\(S \propto \frac{1}{p_r}\)
if price of raw materials, transport and complimentary goods like oil increase, then supply decreases
Number of Sellers
\(S \propto n\)
greater the no of sellers, greater the market supply
Producer Sentiments
mindset of producers
- if it is positive, then supply increases
- else supply decreases
Market Equilibrium
market situation when price has reached the level where quantity supplied = quantity demand
no tendency for change in price/decisions, as both producers and consumers are satisfied
in the long run, excess demand and supply tends to 0
Auctions take place until equilibrium is reached
Evaluating Equilibrium Price/Quantity
- Get \(P\) by equating demand and supply functions and solving them
- Get \(Q\) by substituting \(P\) in either function (both gives the same answer)
we can also draw a graph and obtain the point of interception of the supply and demand curves

Dis-equilibrium
Whenever there is a disequilibrium, the market automatically adjusts the price
| Surplus | Shortage | |
|---|---|---|
| Characteristic | Excess Supply/ Low Demand | Excess Demand/ Low Supply |
| Buyers not willing to buy | Sellers not willing to sell | |
| Price | Actual > Equilibrium | Actual < equilibrium |
| Automatic Correction | Actual price will reduce to equilibrium price automatically, as there is low demand | actual price will increase to equilibrium price automatically, as there is low supply |
Automatic market correction mechanism always occurs, given that
- Prices are flexible
- Market free from government intervention
- Both buyers and sellers are equally-informed about the market (internet has helped with making information symmetric); otherwise there will be one or more of the following
- sellers will manipulate buyers
- all the sellers will be selling bad products, as it more profitable to do so
- company recruiters will only get bad candidates as the salary they provide will be amazing for bad candidates, but too low for good candidates so only the bad candidates will end up accepting the job
- buyers will be hesitant to pay higher price, even when the seller is justified to ask that much
Govt
Whenever there is govt intervention in market dis-equilibrium, there will be always be a tendency for the existence of a parallel black market. Black market (not the illegal market one) is a market that sells commodity at price cheaper than govt-issued price.
Events
- Determine if the event changes the demand/supply
- Determine the shift in the curves
- Find how the equilibrium price and quantity are affected
Change in Equilibrium
| Direction of Shift in Demand & Supply Curve | Cause | Meaning |
|---|---|---|
| Right/Left | Change in constant | Change in factors other than price |
| Angular upward/downward | Change in coefficient of price | Change in price |
Imagine an auction
| Supply const | Supply inc | Supply dec | |
|---|---|---|---|
| demand const | P same Q same | P ⬇ Q ⬆ | P ⬆ Q ⬇ |
| demand inc | P ⬆ Q ⬆ | P ambiguous Q ⬆ | P ⬆ Q ambiguous |
| demand dec | P ⬇ Q ⬇ | P ⬇ Q ambiguous | P ambiguous Q ⬇ |
Ambiguous –> it depends on the relative change bw the supply and demand
Misc
Black Money
The money isn’t necessarily illegal, the problem is that the transaction is unofficial, to avoid paying taxes for the transaction.
Demonetization
They assumed that all black wealth is in the form of cash, but if you look at data - 0.0002% of total wealth is in the form of cash - only ~1% of black wealth is in cash
Demerits were the cost of - Printing the notes - Time of people in queues wasted and hence they did not perform productively - Informal sector shops lost everything, due to the above
It mainly did one thing: introduction of a new commodity: old currency
Fake Currency
Fake currency is only an issue if it facilitates illegal activities. However, as long as fake currency is used for legal activities, then there is no problem from the perspective of economics. However, if the proportion of fake money is too large, then there is risk of inflation
Monopoly
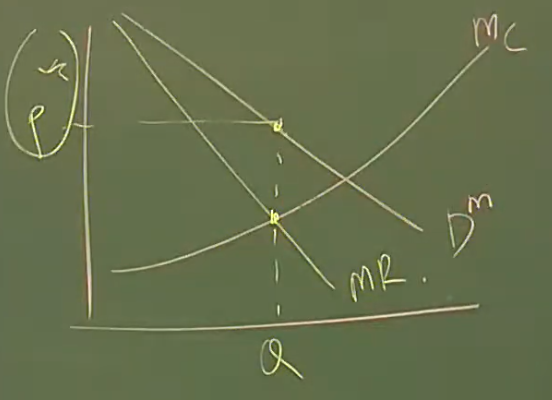
Monopoly supplier produces at the quantity where Marginal Revenue & Marginal Cost intersect